【教程简介】
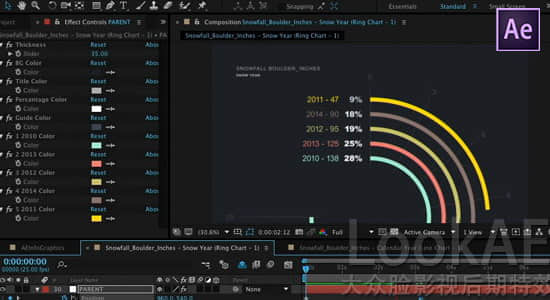
学习如何在Adobe After Effects软件中制作信息数据动画图表
生活中一般的图形制作是在 Illustrator、PowerPoint、PS 等软件中处理,但这些 图形无动画很平乏无趣
在这教程中,涉及的AE内容:动画图表形状层,遮罩层,文本动画等
还展示了如何使用表达式来链接在不同的图形元素间建立动态的动画,摄像机的运动,
且还用Cinema 4D Lite 创建了一些3D动画图表,
教程为高清视频教程,英语对白,无中文字幕。
Learn how to animate infographics with Adobe After Effects! Many infographic elements begin life in applications like Illustrator, Photoshop, or PowerPoint. But these assets can be flat and boring; animation is what brings them to life. In this course, After Effects guru Ian Robinson covers animating charts and graphs with shape layers, layer masks, and stroke and text animators. He also shows how to use expressions to link animation between different graphic elements, build dynamic camera moves, and create some animated 3D infographics with CINEMA 4D Lite. To finish things off, he’ll look at some third-party tools such as Cinema Spice Charts & Graphs for After Effects and aescripts, which help speed up some of the techniques you learned earlier in the course.
https://www.lynda.com/After-Effects-tutorials/After-Effects-Guru-Animating-Infographics/397611-2.html
教程涉及内容:
准备动画插图和PS图象处理软件图表
分离成层的扁平信息图表动画
将 Illustrator文件 转换为形状图层更详细的动画
动画和链接更多的视觉冲击在其他图形元素
Cinema 4D Lite 创建了一些3D动画图表
制作动画效果
使用第三方工具加快信息图形工作流
【教程下载】
AE教程:信息数据柱状图统计动画制作教程 Lynda – After Effects Guru Animating Infographics